- [email protected]
- 27-31 Wright St, Clayton VIC 3168
- Contact
13Feb
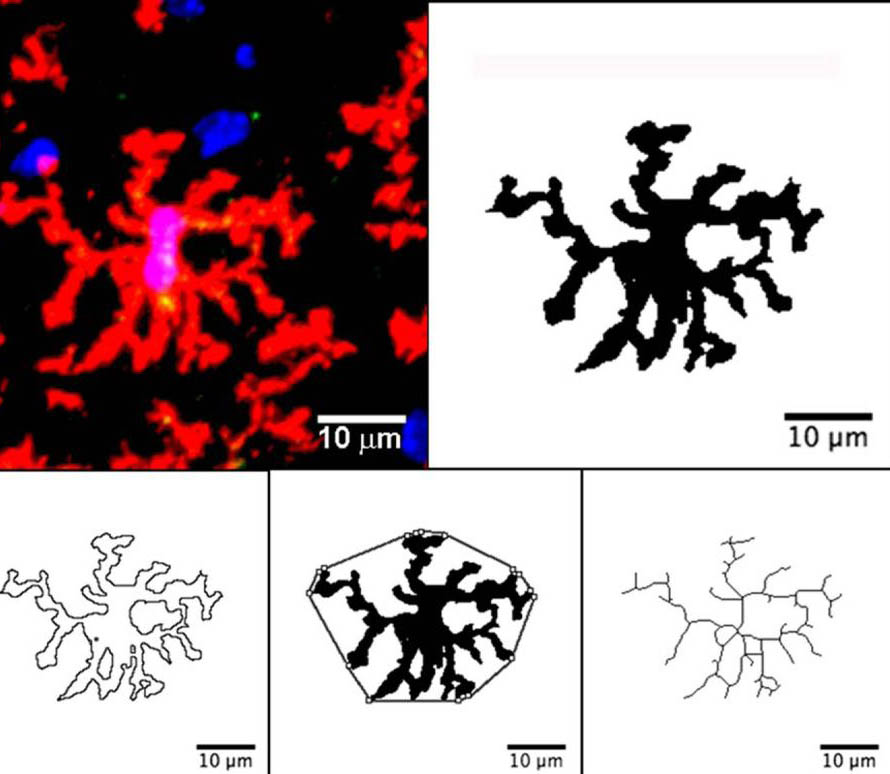
How to Quantify Microglia: Analyse Skeleton
by Elazadeh, 0 Comments
 Update FIJI: Help>update>ok>apply all changes>ok
Set scale:
– 1st option: by having a scale on an image and knowing “Known distance” as below:
Drag your image to FIJI> Use the straight tool and draw a line at the same length of the image scale
Analyse> Set scale> Set options as:
Known distance= The scale length on the image (for example, write 100 for 100 µm)
Pixel aspect ratio= Based on the dimension of the image
*(Pixels are typically square, which results in a pixel aspect ratio of 1:1. But images that are optimised for certain types of displays can also have rectangular pixels with an aspect ratio of 4:3 or similar).
Unit of length= µm
Select “Global”
– 2nd option: The snapshot of the Olympus microscope 40x is 2448 x 1920-pixel resolution (pxR)
2448 pxR = 422.28 µm
1920 pxR = 310.20 µm
Drag your image to FIJI> Analyse> Set scale> Set as below:
Distance in pixels= 1920.0042
Known distance=310.20
Pixel aspect ratio= 1.28
Unit of length= µm
Select “Global”
* After setting the scale, by opening a new image unselect “Disable scale” if the image is in the same dataset and magnification scale.

Batch processing:
Create folder “1” on your desktop>open FIJI>Process>batch>macro> define input (your original images) and output (folder 1)> select format TIFF>copy+ paste macro code 1>Process
File>SaveAs>Results as “area” file: Use this file to know the total area of the image (µm) if the pictures are not of the same size
Create folder “2” on your desktop>open FIJI>Process>batch>macro> define input (folder 1) and output (folder 2)> select format TIFF>copy+ paste macro code 2>Process
FIJI>file> Save As summary as “microglia” only for Count (total number of the microglia)
Create folder “3” on your desktop>open FIJI>Process>batch>macro> define input (folder 1) and output (folder 3)> select format TIFF>copy+ paste macro code 3>Process
8 File>SaveAs: Branch information and new results files (as branch length)
Open “microglia” CSV file>SaveAs: Excel workbook: Calculate the number of the microglia from the “Count” column/ total area of the image from (Get the entire area from the “area” file) copy+ paste in the count file.
Go to the “branch length” file>Select all>Data>Sort>Sort by Maximum Branch Length: from largest to smallest>Ok.
Go to the “Branch Information” file>Select all>Data>Sort>Sort by Branch Length: from largest to smallest>Ok
Remove every row with a “maximum branch length” of less than the artifacts (on an average: less than 0.37 µm, which needs to be measured.
Data can be displayed as “Average branch length” or “Maximum Branch Length”, showing microglia types from ameboid > reactive> ramified microglia (as a gradient) Or
Measure the length of at least 30 amoeboid, reactive and resting microglia (mean+SD). Use “Maximum Branch Length” > set a graph for each type of microglia.
Batch processing gives an average amount for each image
Alternatively, for every single image, each macro can be run from:
FIJI>Plugins>Macros>Run> each macro code one by one